Author: Huarui Zhou
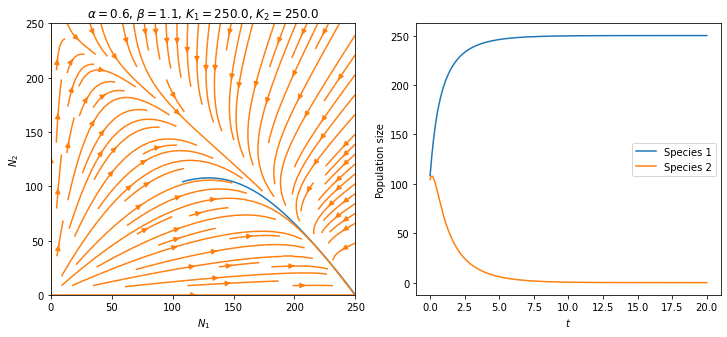
Suppose there are two species that live in the same area and will compete for food, space and other resources. Let $N_1$ and $N_2$ be their population size, $r_1$ and $r_2$ be their ideal growth rate, $K_1$ and $K_2$ be their maximal population size. We can establish the following differential equations.
from scipy import spatial as sp
import numpy as np
from scipy import integrate
import matplotlib.pyplot as plt
from mpl_toolkits.mplot3d import Axes3D
import math
def LV_deriv(x, t0, alpha=1, beta=1, K1 = 100, K2=100,r1=1, r2=1):
    return (r1*x[0]*(1-(x[0]+alpha*x[1])/K1),
            r2*x[1]*(1-(x[1]+beta*x[0])/K2))

def LV_plot(alpha,beta,K1,K2,r1,r2, max_time=20,start_x = 10, start_y=10,run=True) :


    if not run:
        return "not run"

    x1_0 = [start_x,start_y]
    # starting vector


    t = np.linspace(0, max_time, max_time*1000) # time step is fixed
    x1_t = integrate.odeint(LV_deriv, x1_0, t, args=(alpha,beta, K1,K2,r1,r2))

    x, y = np.meshgrid(np.linspace(0, K1,2500), np.linspace(0, K2, 2500))
    u = r1*x*(1-(x+alpha*y)/K1)
    v = r2*y*(1-(y+beta*x)/K2)

    fig =plt.figure(figsize=(12,5))

    ax1= fig.add_subplot(1,2,1)
    ax1.plot(x1_t[:,0], x1_t[:,1])
    plt.streamplot(x, y, u, v)
    plt.xlim([0, K1])
    plt.ylim([0, K2])
    ax1.set_xlabel("$N_1$")
    ax1.set_ylabel("$N_2$")

    plt.title('$\\alpha =' + str(alpha) + '$, $\\beta =' + str(beta)
              + '$, $K_1=' + str(K1) + '$, $K_2=' + str(K2) + '$')


    ax2 = fig.add_subplot(1,2,2)
    ax2.plot(t,x1_t[:,0], label = 'Species 1')
    ax2.plot(t,x1_t[:,1], label = 'Species 2')
    ax2.legend()
    ax2.set_xlabel("$t$")
    ax2.set_ylabel("Population size")

    plt.show()


from ipywidgets import interact, interactive, Checkbox
from IPython.display import clear_output, display, HTML
interact(LV_plot, alpha=(0.0,5.0),beta=(0.0, 5.0),
         r1=(0.0, 10.0),r2=(0.0, 10.0),K1=(0.0,500.0),K2=(0.0,500.0),
         max_time=(10,100,1), start_x = (0.0,500.0), start_y = (0.0,500.0), run=Checkbox(value=False))
interactive(children=(FloatSlider(value=2.5, description='alpha', max=5.0), FloatSlider(value=2.5, description…
<function __main__.LV_plot(alpha, beta, K1, K2, r1, r2, max_time=20, start_x=10, start_y=10, run=True)>